
1) Problem Definition
Reporting the project status using Earned Value (EV) measurements;
- Budgeted cost of work performed (BCWP);
- Budgeted cost of work scheduled (BCWS);
- Actual cost of work performed (ACWP);
2) Identify the Feasible Alternative.
This essay aims to use EV calculations to identify the project current status in terms of;
- Cost Variance (CV);
- Schedule Variance (SV);
- Cost Performance Index (CPI);
- Schedule Performance Index (SPI)
The EV calculations are based on the report received from field on day 180 shown in figure.1 below.
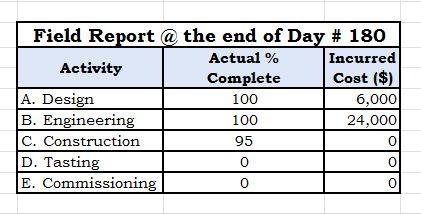
Figure.1: Field Report
3) Development of the Outcome for Alternative
In order to use EV measurements, project Scope, Schedule and Budget are needed. The following figure and tables are examples. Figure.2 is an example of phasing the project budget over the schedule so cumulative S-Curve can be generated. I have used “0/100” formula when calculating the completion % for the work element. I.e. an activity credit value is 0% when its start and 100% credit value when it’s completed only; therefore, an activity with 75% physical completion has 0% credit value.
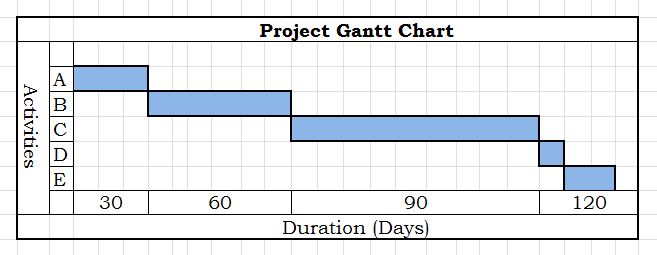
Figure.2: Project Schedule
| Activity | Predecessor | Duration
(Days) |
Cost/Day
US ($) |
Total Cost
US ($) |
| A. Design | 30 | 200 | 6,000 | |
| B. Engineering | A | 60 | 400 | 24,000 |
| C. Construction | B | 90 | 600 | 54,000 |
| D. Tasting | C | 10 | 100 | 1,000 |
| E. Commissioning | D | 20 | 300 | 6,000 |
Table.1: Project Budget
Figure.3: Budget Over Time (Time Phase)
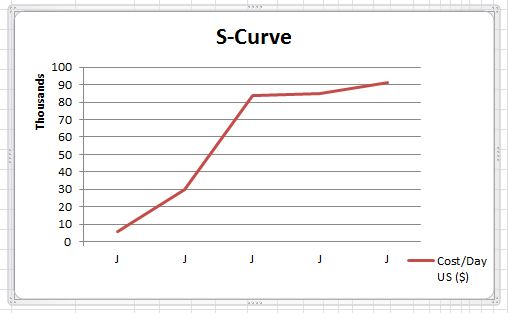
Figure.3: Project S-Curve
4) Selection of Criteria.
Earn value method was adopted for the indication of the status of the project are shown in the following table.
| Activity | ACWP
($) |
BCWP
($) |
BCWS
($) |
CV
($) |
SV | CPI | SPI |
| A. Design | 6,000 | 6,000 | 6,000 | – | – | 1 | 1 |
| B. Engineering | 24,000 | 24,000 | 24,000 | – | – | 1 | 1 |
| C. Construction | – | 51,300 | 54,000 | 51,300 | -2,700 | – | 1 |
| D. Tasting | – | – | – | – | – | – | – |
| E. Commissioning | – | – | – | – | – | – | |
| Total | 30,000 | 81,300 | 84,000 | 51,300 | -2,700 | 2.7 | 0.968 |
Table.2: Earned Value Calculation
5) Data Analysis.
The project CPI is great (2.7); while the SPI is (0.968) which is a bad sign meaning that the project is behind schedule. Maybe some recovery actions are required to keep the project back on truck on a later stage.
6) Selection of the Preferred Alternative.
From the analysis, at the current stage no corrective actions are required as SPI is every close to 1. A major observation, we may thank of revised our payment formual “completion % for the work element” so we can pay our contractors based on the physical completed % reported of the activity rather than 0\100% method. The “Doggy Biscuit” method can be taken onto consideration to support resources availability and contractors performances.
7) Performance Monitoring and the Post Evaluation of Result.
It can be concluded, the Earned Value analysis is one of the best methods of measuring projects as it’s evaluate the status of the project for both Schedule and Budget. It’s a tool helps managers to identify and control the current and potential issues on the project; so the project can be managed better on terms of time and cost.
8) References
- Source: Guild of Project Controls, 9.0 – MANAGING PROJECT PROGRESS. http://www.planningplanet.com/guild/GPCCAR-modules
- Duncan Haughty (2010). What is Earned Value? [ONLINE] Available at: http://cdn.projectsmart.co.uk/pdf/what-is-earned-value.pdf. [Last Accessed 10 June 2014].
- Booz Allen Hamilton (2010). Earned Value Management Tutorial. [ONLINE] Available at: http://energy.gov/sites/prod/files/maprod/documents/EVMModule6.pd. [Last Accessed 10 June 2014].
- Suketu Nagrecha (2002). An introduction to Earned Value Analysis. [ONLINE] Available at: http://www.pmiglc.org/COMM/Articles/0410_

Nice case study Nasser but you’ve pointed out the real problem if the owner turns committed costs into planned costs 0r BCWS.
Unless you include your OWNERS original budget, your CPI is always going to be 1.0……. And your CV will always be $0.00.
Which is why you should NEVER substitute COMMITTED costs in place of your original OWNERS ESTIMATE.
Also under Activity C- Construction you have a BCWP of 51,300 and a BCWS of 54,000. That means your SPI is not 1 as you are showing but 0.95???
Lastly in Figure 3 you are only showing what I presume to be the EARLY date curve? I really try to discourage people from using ONLY the early date curve as that generally tells us very little. What is really MORE important is the LATE DATE curve, as that is the one which is telling you whether or not your project is in trouble or not.
(As you will find out as soon as you finish up your first weekly report…..!!!)
How about taking the same case study but for your W3 blog, ADD IN the following information:
ORIGINAL APPROVED BUDGET (BCWS) Early Dates
ORIGINAL APPROVED BUDGET (BCWS Late Dates)
Projected Date of Completion (using all 3 methods)
Projected Cost of Completion (using all 4 methods)
Bottom line- a good START but nowhere near the level of sophistication and understanding I hope to be seeing you generate before this course is over…..
Let me know if you get stuck fixing this nice case study for your W3 blog posting….
BR,
Dr. PDG, Jakarta
LikeLike