W4_Hamood Al Rusheidi_ Car Selection Using MADM Attributes

 1)      Problem definition

In the previous blog (W3) I have used Grid Analysis technique to make a decision (buying a family car) from three possible choices. The analysis findings recommend going for Nissan Patrol.

I will use the same case study but using MULTI-ATTRIBUTE DECISION MAKING (MADM). The MADM is more useful with the subjective attributes rather than financial like my case study.

2)   Feasible alternatives

After a comprehensive discussion with experts I have narrowed my selection to three choices: Yukon, Lexus 4WD and Nissan Patrol.

 3)      Developments of the outcomes of the alternative

There are four attributes that are governed the selection of each brand:

  1. Price,
  2. Re-Sale Price
  3. Size for family
  4. Suitability for graded roads

4)      Selection of the criteria

The MADM has two main approaches and each one has different techniques:

  1. The non-compensatory approach
  2. The compensatory approach

1.1-The non-compensatory approach – Dominance:

Assume all attributes are equally important. From Figure-1 It is Lexus 4WD.

w4-1
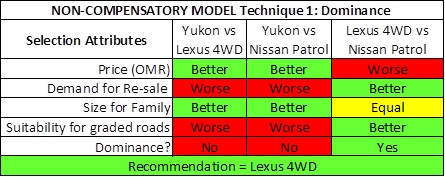
Figure 1 The Concept of Dominance

1.2-The non-compensatory approach – Satisfying:

We pick the minimum and maximum acceptable values and eliminate the rest. Per Figure-2 the choice is Nissan Patrol.

w4-2

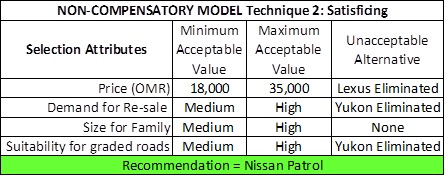
Figure 2 NON-COMPENSATORY MODEL Technique 2: Satisficing


1.3-The non-compensatory approach – Disjunctive Reasoning:

Conduct a Pair-Wise comparison and we give a score of 1 to the WINNING OPTION and a score of 0 to the losing option. From Figure 3 the “Price” is the most important attribute.


 w4-3

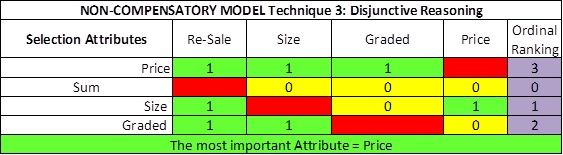
Figure 3 NON-COMPENSATORY MODEL Technique 3: Disjunctive Reasoning

 1.4-The non-compensatory approach – Lexicography:

Rank the attributes per ordinal ranking from Disjunctive Reasoning and compare our options. Per Figure-4 the choice will be Yukon.

 w4-4

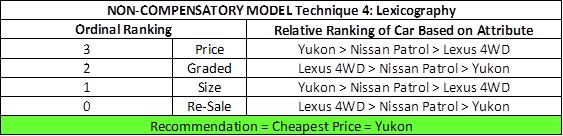
Figure 4 NON-COMPENSATORY MODEL Technique 4: Lexicography

 5)      Analysis and Comparison of the Alternative

Now we will use compensatory approach which has two methods.

A-COMPENSATORY MODEL-Dimensional Scaling Technique.

Consist of two steps:

  1. Turn the relative options into a “base 1” or dimensionless value (see figure-5)

w4-5

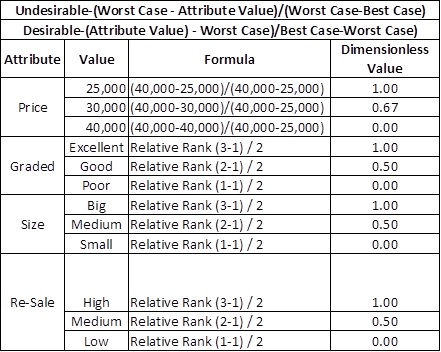
Figure 5 Turning each option into a Base 1 (dimensionless) scoring model


  1. Calculate the relative weighting of each attribute (figure-6):

w4-6

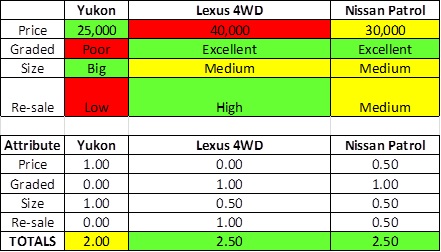
Figure 6 Relative Weighting

B-COMPENSATORY MODEL-Di Additive Weighting Technique.

Consist of 3 steps:

  1. Add up the total of relative ranking of all options which comes out to be 10
  2. Normalize the weighting of each attribute which gives 1.00
  3. Multiply normalized weighting by each option


w4-7

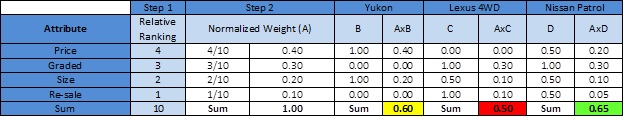
Figure 7 Additive Weighting Technique

Figure-7   indicates the Nissan Patrol is the best choice.
 

6)      Selection of the Preferred Alternative.

The above findings reveal that the final selection will depends mainly on your preference and most preferred attributes. Though I found the last techqnies is the best as it indicates how much better a choice compare to another is. Nissan Patrol is the final selection.


7)      Performance Monitoring and the Post Evaluation of Result

I have bought the car and in 8 years’ time I will revisit this blog to compare the actual findings with the assumptions made above.

8)          References

W3_Hamood Al Rusheidi_ New Car Selection


 1)      Problem definition

I am in the process of buying a new 4WD car but I am not confident what the best choice that I should go for. This blog will attempt to settle to a final decision by employing choices selection technique.

To do so I will employ Grid Analysis which is a useful technique for making a decision. It is most effective where you have a number of good alternatives and many factors to take into account.

 2)   Feasible alternatives

After a comprehensive discussion with experts I have narrowed my selection to three choices: Yukon, Lexus 4WD and Nissan Patrol.

 3)      Developments of the outcomes of the alternative

There are four factors that are governed the selection of each brand:

  1. Price,
  2. After Sale Price
  3. Size for family
  4. Suitability for graded roads

4)      Selection of the criteria

Based on the selection criteria I have come up with the following findings:

Criteria/Model Yukon Lexus 4WD Nissan Patrol
Price (OMR) 25,000 40,000 30,000
Demand for Re-sale Low High Medium
Size for Family Big Medium Medium
Suitability for graded roads Low High High

Figure 1. Analysis Comparison [1]

5)      Analysis and Comparison of the Alternative

By using Grid Analysis, the comparison of the above criteria will be as below:


Criteria/Model Yukon Lexus 4WD Nissan Patrol
Price (OMR) 3 1 2
Demand for Re-sale 1 3 3
Size for Family 3 2 2
Suitability for graded roads 1 3 3
Total 8 9 10

Figure 2. Weight Assessment [2]

Legend:

Price: 3=Cheapest, 2=Cheaper, 1=Cheap

Demand for Re-sale: 3=High, 2=Medium, 1=low

Size for family: 3=Big, 2=Medium, 1=Small

Suitability for graded roads: 3=High, 2=Medium, 1=Low


6)      Selection of the Preferred Alternative.

Further to the exercise applied (Grid Analysis), the above table shows that “Nissan Patrol” scored the highest ranked which can be considered as the preferred alternative.


7)      Performance Monitoring and the Post Evaluation of Result

The table clearly indicates to go for Nissan Patrol. Therefore, Grid analysis has really helped me to make a solid decision based on a scientific technique. I have bought the car and in 8 years’ time I will revisit this blog to compare the actual findings with the asumptions made above.

8)          References

W1.1_Hamood Al Rusheidi_ Tuckman Analysis

 1)      Problem definition

A new team called OOCEP, has been established in July 2016 consists of 10 members working for the same employer; Oman Oil Company Exploration & Production (OOCEP). The team will work together in a 13 weeks program consists of a series of sessions: face to face, distance learning, assignments, blogs, and will be finalized with a PMP certification exam no later than December 2016.

The first blog will examine at what stage OOCEP team is in and thereafter define the most suitable leadership style for the team.


2)   Feasible alternatives

A good tool to help identify leadership style of the team is to use Tuckman’s analysis (1) which links the leadership style to four stages of team development: Forming, Storming, Norming and Performing. Leadership styles of each stage are illustrated in Figure-1.

W 1.1 Figure-1

Figure 1 Tuckman’s stages s and leadership styles

3)      Developments of the outcomes of the alternative

In order to know the team development stage a survey developed by Donaled Clark was used which consists of 32 questions. The result will guide us on the behaviours of each of four stages as per Tuckman Model. The result is illustrated in figure-2.

W 1.1 Figure-2

Figure 2 Donald Clark Survey Results


4)      Selection of the criteria

Now, to decide at what stage the team is, Dephi technique with P-90 is used. The result is presented in Figure-3 (PERT Analysis).

W 1.1 Figure-3

According to the above result, P-90 gives the highest score of 24.8 for the Performing stagge which is the current stage of OOCEP team.


5)      Analysis and Comparison of the Alternative

It is evident from the above there is a probably of 10% only that OOCEP team should be in any other stage than Performing; which is very low. Giving the fact that the team members’ work for the same employer this helps them to pass through storming which is one of the hardest stages pretty smoothly. In addition to that most of the team members are from the same background (engineering) which is forms a solid foundation for a good performing team.


6)      Selection of the Preferred Alternative.

Figure 3 above which put OOCEP team at the Performing team should be consulted with Figure-1 which indicate that team members should delegate more authority and concentrate on developing team members as a preferred alternative.

7)      Performance Monitoring and the Post Evaluation of Result

Working in the same office will make it easy for the team to meet frequently to assess the project progress and meet the schedule. I believe the same analysis will need to be conducted sometimes after 5 weeks to reflect on the progress.


8)          References

W2_HamoodRushaidi_ RACI Matrix’s Contribution to a Project’s Success

1)      Problem definition

As a Project Interface Manager I was giving a mandate to manage the first oil crude shipment from Musandam Gas Plant Terminal. There are several disciplines involve in this operation: Project, Security, Admin, HSE and Operation.


2)   Feasible alternatives

To deliver this important milestone and manage these interfaces I used RACI’s Matrix Technique. RACI matrix definition is illustrated in Figure-1 below. It is basically define the manual of authority of each particular task or project and how each level of authority for decision making interfaces with other parties engaged in the same project/task. This process ensures that one person is committed to producing results and decreases conflict between different roles (1).

W2 Figure 1 RACI martrix

Figure 1 What is RACI? (1)

3)      Developments of the outcomes of the alternative

In order to implement RACI matrix I have marked each activity with the concern work areas (Project, Security, Admin, HSE and Operation) as per figure-2. Then, this followed with assigning the level of authority (responsible, accountable, consulted or informed) for each activity.

W2 Figure-2 Activity List

Figure 2 Team Activity List


4)      Selection of the criteria

Then, the RACI matrix helped to assign the responsibility of each team member as per figure-3.The


W2 Figure 3

Figure 3 the Team RACI Matrix

The RACI Matrix clearly identifies the involvement of each team member in each activity.

5)      Analysis and Comparison of the Alternative


The above information represented in figure-2 and figure-3 will be heavily consulted for the for the following purpose:

  1. Work-load (2): it will help the responsibly manager to divide the work load per team members evenly
  2. Re-organization (2): to avoid any duplication of the same activity with different team members.
  3. Employeeturnover (2): a good guide of roles and responsibilities for the new employees
  4. Work assignment (2): helps to reassign activities for new members.
  5. Project management (2): sets clear cut between line and project accountabilities
  6. Conflict resolution (2): a good reference to consult at situation when conflicts regarding responsibilities occurred.
  7. Document the status-quo (2): the matrix serves as a good documentation for the activities status.

6)      Selection of the Preferred Alternative.

Now, it has become pretty easy to align team member’s roles and responsibilities. The deliverables are well known and development plan for employee if needed to deliver their tasks can be delivered with a comprehensive competency plan. Line of reporting and delegation in case of absence has become clear to all team members too.

In short, Advantages of using RACI matrix are well clear and it is a great management tool for project managers and all team members in terms of communication and clarity.

7)      Performance Monitoring and the Post Evaluation of Result

As the first crude shipment has already been succesfuly delivered we are now looking for the second shipment in October. RACI will be utilized on a weekly to bring all team members up to speed.

8)          References

  1. Jared Munk (2013, October). The Benefits of the RACI Chart. Retrieved August 30, 2016, http://www.sixsigmadaily.com/the-benefits-of-the-raci-chart/
  2. Royston Morgan (2008, December). How to Do RACI Charting and Analysis: A Practical Guide. Retrieved August 30, 2016 http://www.projectsmart.co.uk/how-to-do-raci-charting-and-analysis.php


W1_Hamood Al Rusheidi_ Tuckman Analysis

  1)      Problem definition

Oman Oil Company Exploration & Production (OOCEP) has selected 10 staff to go for PMI certification program. The 13 weeks program organized by PT Mitrata Citragraha from Indonesia and consists of a series of sessions: face to face, distance learning, assignments, blogs, and will be finalized with a PMP certification exam no later than December 2016. Blog posting is one of the program delivered and first week blog topic is to explore the status of group development and how it will be organized to achieve one of the main program objective: getting the PMI certificate.


2)   Feasible alternatives

A good tool to help identify the group stage of development is to use Tuckman’s analysis (1) which links the group stage development in terms of relationship, behavior and cooperation with time  (Figure 1). Tuckman has introduced a 5th stage (adjoining) which is not part of this group analysis.

Figure-1 Group Stages


3)      Developments of the outcomes of the alternative

To demonstrate Tuckman’s tool practically a Donald Clark (2) survey was used and the result of the 10 group members is illustrated in figure-2.

Figure-2 Hamood

4)      Selection of the criteria

To make use of the data collected in section 3 above PERT analysis was used and the findings are illustrated in figure-3.

figure 3 hamood

From figure 2 and 3 we can identify three criteria that will narrow our selection for the current group state: total stage score, Mode and P-90 using Delphi technique (3).  The reason to select the mode instead of the mean is that we are aiming to find the most common category .

5)      Analysis and Comparison of the Alternative

All three selection criteria suggested that the group currently at the “Performing stage” as it has the highest score, highest mode and highest P-90. When comparing the result with the reality and what was achieved so far I can see that Tuckman’s model works very well. We have reached performing stage after we physically select the program manager, project managers and their assistance. There are now clear roles and responsibilities which are fully respected and followed by the team.

6)      Selection of the Preferred Alternative.

The above analysis also revealed what we have acheivced durig face-to-face session. The group managed to establish the project team structure without supervision. In my opining despite the fact that most of the 10 team members came from different departments but they didn’t spend much time in the “forming” stage and move straightaway in the “storming” stage. Maybe, the fact they are working for the same employer make a common ground for the group.

7)      Performance Monitoring and the Post Evaluation of Result

Working in the same office will make it easy for the team to meet frequently to assess the project progress and meet the schedule. I believe the same analysis will need to be conducted sometimes after 5 weeks to reflect on the progress.

8)          References

  1. Nestor, R. (2013), “Bruce Tuckman’s Team Development Model, Tuckman 1965” Aurora, [Online retrieve 8-8-2016 from https://www.lfhe.ac.uk/download.cfm/docid/3C6230CF-61E8-4C5E-9A0C1C81DCDEDCA2
  2. Donald Clark (2002). Survey: what stage is Your Team In? [Online Retrieved Aug 6, 2016, fromhttp://www.cscaweb.org/EMS/sector_team/support_files/tools_for_the_team/tool_stage.pdf
  3. Duncan Haughey. (nd). Delphi Technique a step-by-step Guide. [Online Retrieved Aug 6, 2016, http://www.projectsmart.co.uk/delphi-technique-a-step-by-step-guide.php