- Problem Recognition, Definition and Evaluation
In a bid process, generally bidders are given specific time to prepare a bid document & submit the required document to the Company on agreed closing date. In this blog posting will conduct analysis related to time and cost needed to prepare the appropriate estimation by the contractors in a bid process for E&P Companies.
The time required to prepare an estimation during a bidding will be compared to the existing company practice stated that “bidder should submit their bidding proposal 3 to 4 weeks”.
The following project value classification used in Oil & Gas Company will be used in this blog:
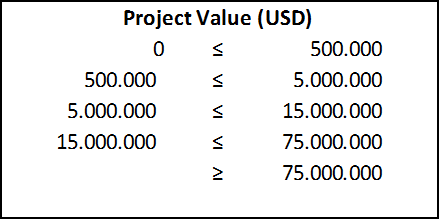
Table 1. Project Value Classification
2. Identify the Feasible Alternatives
The below matrix provides an estimate classification for generic cost.
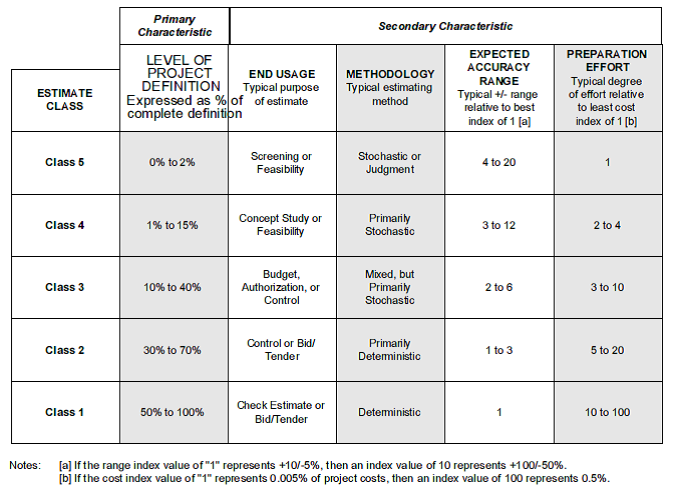
Table 2. Cost Estimate Classification System
3. Development of the Outcomes for Alternative
Based on the above matrix, cost estimates can be described as follow:
- Class 5 estimates are generally prepared base on very limited information.
- Class 4 estimates are typically used for project screening, determination of feasibility, concept evaluation, and preliminary budget approval.
- Class 3 estimates are used as the project budget until replaced by more detailed estimates.
- Class 2 estimates are often used as the “bid” estimate to establish contract value for contractors.
- Class 1 estimates are typically prepared to form a current control estimate to be used as the final control baseline.
4. Selection of a Criterion
Class 2 estimates are chosen to estimate to prepare the bid for contractors. From the generic cost estimates classification matrix above, the preparation effort are in the range 0.02% – 0.1% of project costs.
5. Analysis and Comparison of The Alternatives
To get the preparation effort (cost and time) for the project, the below external data such as Rate for cost estimator and Assumption of working hours a day are used. In this case, Rate for the cost estimator is US $ 29,03 / hour and 8 hours of work per day. [1]

Table 3. cost estimator rate
Below table shows estimate preparation effort for each project value:
| Project Value |
Effort to prepare (USD) |
Man hours |
Days |
Days* |
| Min(0.02%) |
Max (0.1%) |
Min |
Max |
Min |
Max |
Min |
Max |
| 500,000 |
100 |
500 |
3 |
17 |
1 |
3 |
1 |
3 |
| 5,000,000 |
1,000 |
5,000 |
34 |
172 |
5 |
22 |
6 |
26 |
| 15,000,000 |
3,000 |
15,000 |
103 |
517 |
13 |
65 |
16 |
76 |
| 75,000,000 |
15,000 |
75,000 |
517 |
2,584 |
65 |
323 |
76 |
380 |
Table 4. Bid Estimation Preparation Effort
Days * 85% productivity rate for the cost estimator
The level of effort needed to prepare a given estimate is an indication of the cost, time, and resources required.
Estimate preparation effort is dependent on project size, project complexity, estimator skills and knowledge, and on the availability of appropriate estimating cost data and tools.
6. Selection of the Preferred Alternative
From table 3, the preparation effort to prepare the project estimate for instance a 15 million USD project is range from 13 days to 65 days and 16 to 76 days for 85% productivity.
Based on the company practice, contractor should submit their bidding proposal 3 to 4 weeks (21 to 28 days) in a normal project. In this case study, assumed that the 15 million USD as normal project for the Company.
| Project Value (USD) |
ACCE RP |
Company practice |
| Days |
Days |
| Min |
Max |
Min |
Max |
| 15,000,000.00 |
13 |
65 |
21 |
28 |
Table 5 . Estimation Preparation Effort: Company vs AACE RP
Based on the comparison, the company should revise its bidding practice so that the bidders have more time to prepare their estimation. The longer time to produce estimation, the higher quality of the estimate is and minimize the possible change order during the project execution.
By using the range 0.02% – 0.1% of project costs, a contractor can estimate preparation effort/ to prepare a bid, but it depends on project size, project complexity, estimator skills and knowledge, and on the availability of appropriate estimating cost data and tools.
7. Performance Monitoring and Post Evaluation of Results
The implementation of this analysis, especially for the contractor is that the contractor should monitor their actual spent during estimating preparation not exceed the budget range and time allowance set by the owner during bidding process.
Reference:
- Occupational Employment Handbook. (2016, May). Retrieved from: Bureau of Labor Statistics: http://www.bls.gov/ooh/business-and-financial/cost-estimators.htm
- (2007). Cost Estimate Classification System. In S. J. Amos, Skills & Knowledgeof Cost Engineering (pp. E.1 – E.5). Morgantown: AACE International.
- (2007). Cost Estimate Classification System – as Applied in Engineering, Procurement, and Construction for the Process Industries. In S. J. Amos, Skills & Knowledge of Cost Engineering (pp. F.1 – F.9). Morgantown: AACE International.
- Smith, R. (n.d.). How Much Does / Should It Cost to Prepare a Proposal. Retrieved from Goverment Express: http://governmentexpress.com/articles-proposal.html
- W8_GW_ Costs to Prepare a Bid for a Contractor
- W20_RM_Estimate Preparation Effort For a Bid, Posted on May 24, 2016 by ricomilza


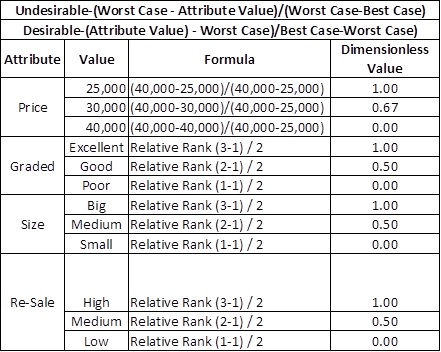
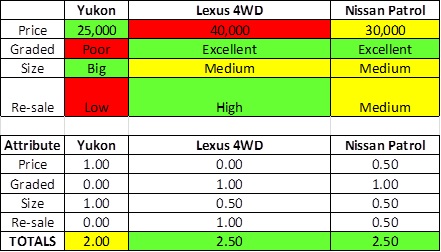
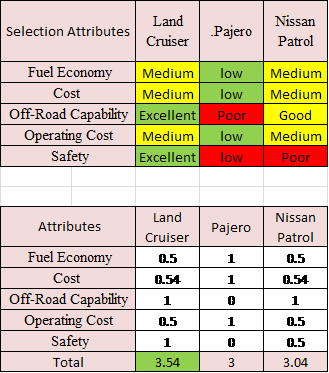 Figure 6 Relative Weighting
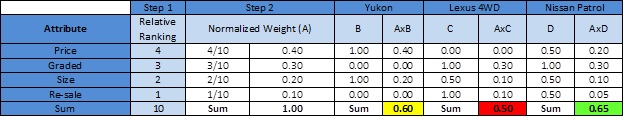
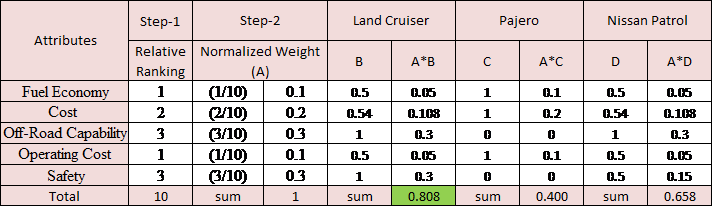 Figure 7 Additive Weighting Technique